Inside the Cover

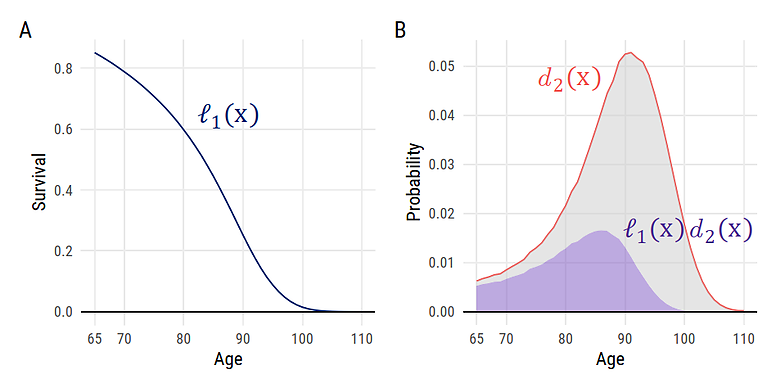
Graphical representation of ϕ: A – Survival curve of population 1, French males; B – life table age at death distribution of population 2, French females and the product of female age at death distribution and male survival (purple area)
From Article:
Outsurvival as a measure of the inequality of lifespans between two populations